Using all three avoids the common mistakes: ranking states by crude rates alone, or treating a records-based national count as if it were a person-at-risk rate.
Quality legal care for life’s ups and downs
Get startedShare with
Published on December 30, 2025 · 10 min read
Key takeaways
- The United States recorded 2,041,926 marriages and 672,502 divorces in 2023, equal to 6.1 and 2.4 per 1,000 people, respectively: figures based on 45 reporting states + D.C., as five states do not submit divorce data to NVSS.
- When adjusting for who is actually married, the refined divorce rate dipped again to 14.2 per 1,000 married women in 2024, continuing the long-running, gradual decline.
- The marriage-to-divorce ratio rose to 2.42, meaning roughly 2.4 marriages for every divorce nationwide: another indicator of the overall shift toward fewer dissolutions relative to marriages.
- State differences remain meaningful: in 2024, Oklahoma (20.7) and Nevada (19.9) had the highest refined divorce rates, while Maine (10.0) and Wisconsin (10.8) had the lowest.
- Divorce rates have diverged by age: they have fallen sharply among younger adults and risen over the long term among older adults, while gray divorce (50+) has now leveled off at 10.3 divorces per 1,000 married women aged 50 and above in 2023.
- Marriage timing continues to shift later, with median first-marriage ages now around 30 (men) and 28–29 (women), shaping who is “at risk” of early divorce and influencing long-term trends.
- Annual national tables mask seasonal filing behavior due to waiting periods such as California’s six-month minimum and Texas’s 60-day minimum, which push final decrees into later months.
How to read the measures (so your comparisons are fair)
- Crude divorce rate (CDC/NVSS): Divorces per 1,000 total population, built from state vital records. Best for long-run trends, but remember the five non-reporting states.
- Refined divorce rate (NCFMR/ACS): Divorces per 1,000 married women. Best for comparing states in the same year, because it controls for how many residents are married.
- Marriage-to-divorce ratio (NCFMR/ACS): Women’s marriages divided by women’s divorces in the last year. An intuitive, single number that shows the system’s balance (U.S. 2.42 in 2024).
The national picture: steadier marriages, gentler divorces
Two long arcs define the 2000–2024 period:
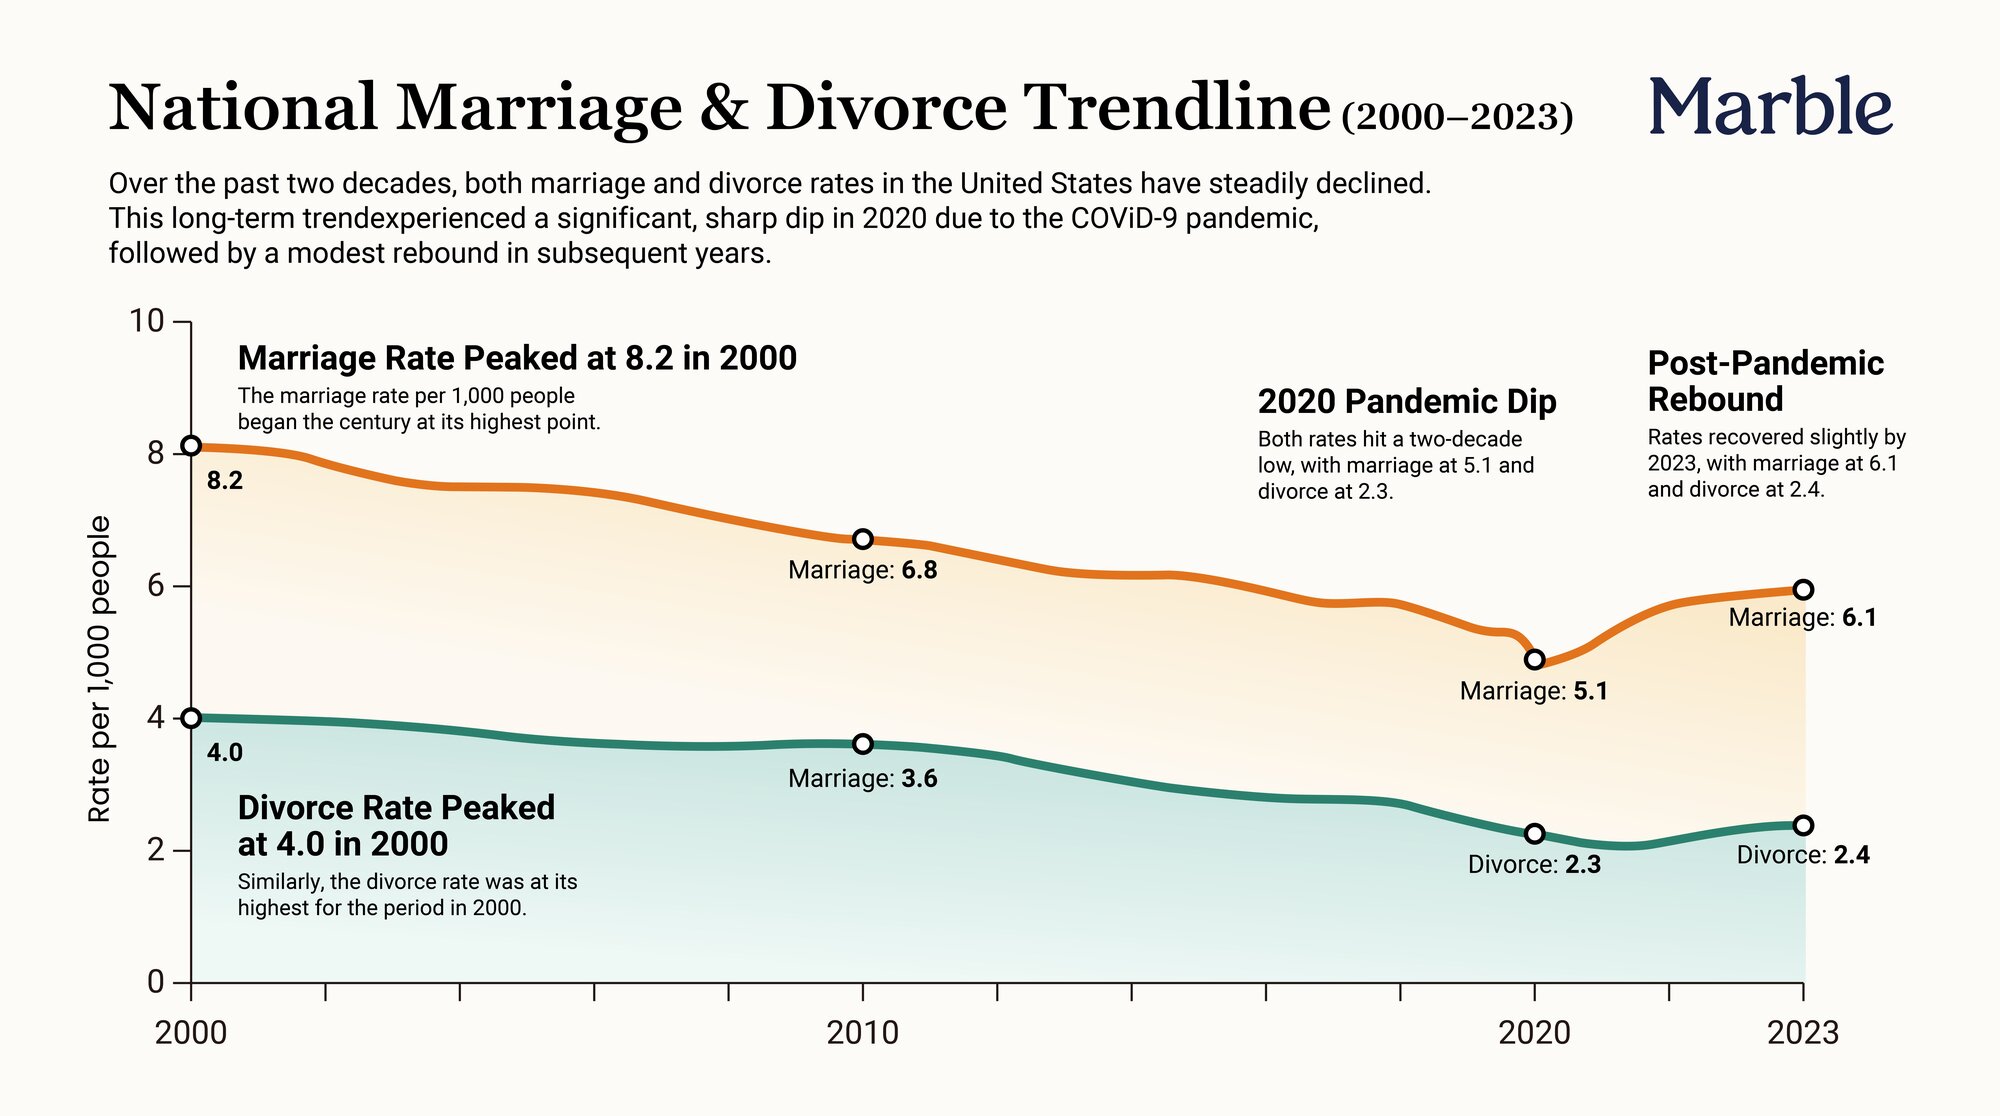
- Marriages fell in 2020 and rebounded. The crude marriage rate dropped to 5.1 per 1,000 at the height of pandemic disruptions, then climbed back to 6.0–6.2 across 2021–2023, with 2,041,926 marriages recorded in 2023.
- Divorces continue a gradual decline. The crude divorce rate reached 2.4 per 1,000 in 2023 (again, among 45 reporting states + D.C.), extending a decades-long easing. Read alongside the refined divorce rate (14.2 in 2024) and the higher marriage-to-divorce ratio (2.42 in 2024), the direction is consistent across measures.
If you zoom out historically, the median age at first marriage has climbed for decades; now around 30 for men and 28–29 for women, a shift that changes who is “exposed” to early divorce at any given time. It’s one reason you can see falling divorce rates among younger adults, even as older-age divorce rates held higher levels.
Why these trends matter for families
These national shifts shape the day-to-day reality of modern family life. Later marriage means couples are entering marriage at more stable ages, which contributes to the consistent decline in divorce among younger adults. At the same time, the stabilization of later-life divorce reflects longer lifespans, evolving expectations for personal fulfillment, and midlife transitions that didn’t exist a generation ago.
State differences add another layer: where you live influences when people marry, how often they remarry, and how local economic pressures affect family stability. When viewed together, these trends help explain why divorce appears lower nationally even as the lived experience of marriage and separation varies dramatically by age group and region.
Source: CDC/NCHS provisional national series (2000–2023). [1][4]
Who is divorcing now: age and life-stage really matter
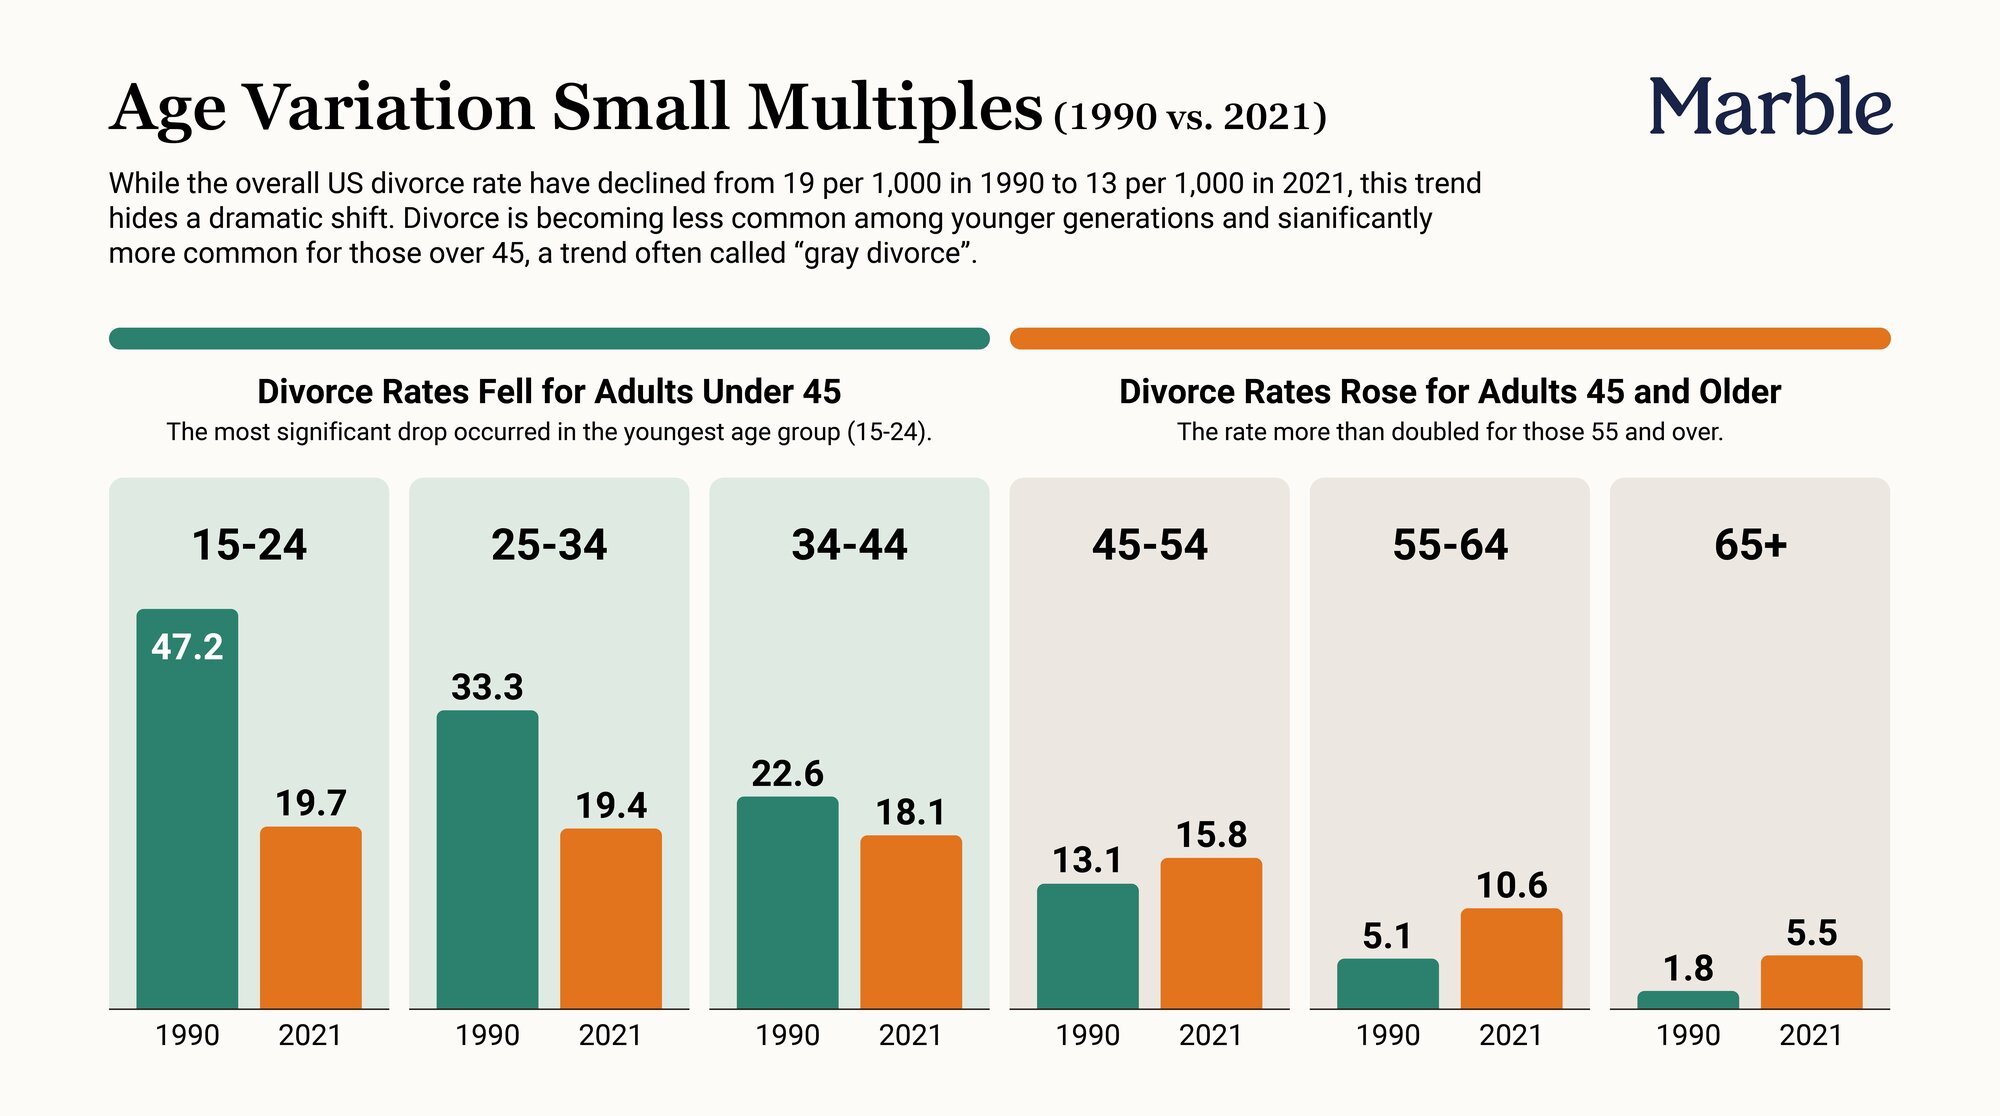
The decline isn’t uniform across ages. NCFMR’s age profiles show that between 1990 and 2021:
- Divorce fell sharply among younger adults: for example, the rate for women 15–24 declined from 46 per 1,000 to 18 per 1,000 (rounding simplified here; see the profile for exact values).
- Divorce rose among older adults: the largest relative increase was among women 65+, from 1.4 to 5.6 per 1,000.
A related story is gray divorce (50+). The rate rose from 3.9 per 1,000 married women 50+ in 1990 to 11.0 in 2008, and has leveled off since, measuring 10.3 in 2023. In other words, later-life divorce stabilized at a higher plateau, even as younger-age divorce declined.
These age patterns live upstream of the national averages. Combine them with the later timing of first marriage, and you get a picture where fewer young couples divorce, more couples split later in life, and the overall line keeps edging down.
The calendar reality (why “January spikes” don’t show up in federal tables)
Federal marriage and divorce tables are annual, not monthly. Even when interest or inquiries cluster at the New Year, final decrees surface months later because state law builds in cooling-off periods and required steps. Two simple examples:
- California: a divorce cannot be final for at least six months from service or response, by law.
- Texas: a court may not grant a divorce before the 60th day after filing, with narrow exceptions.
Marriage timing keeps drifting later (and why that matters)
The Census MS-2 series tracks the median age at first marriage back to 1890. Today’s medians, approximately 30 for men and 28–29 for women, are part of a long climb that accelerated after 1970. Later marriage changes exposure to early divorce, shifts the life-stage at which separations happen, and helps explain how divorce can decline overall while stabilizing at older ages.
State differences you can actually see

At the state level, the cleanest comparison is the refined divorce rate: divorces per 1,000 married women, paired with the marriage-to-divorce ratio. Read together, they show both risk and balance.
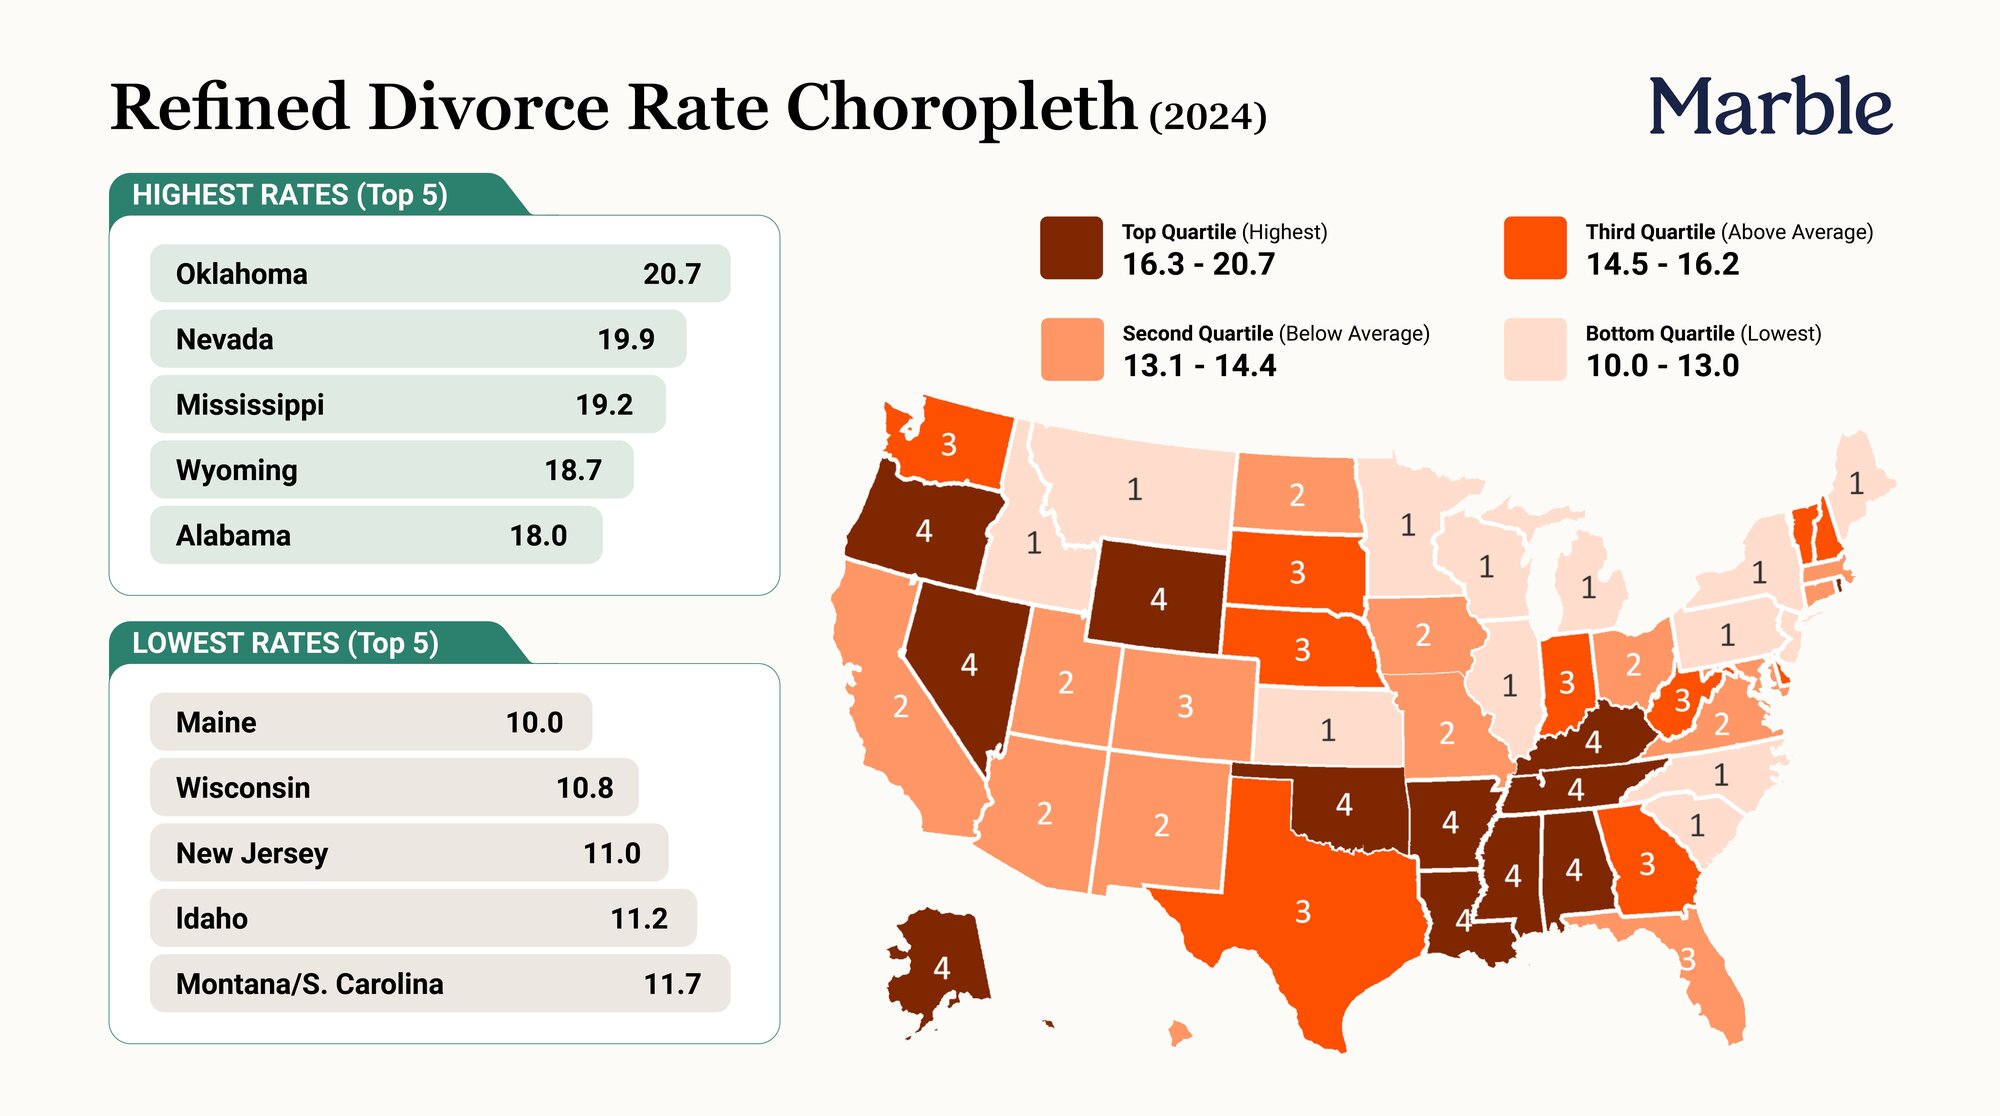
Highest refined divorce rates (2024)
- Oklahoma: 20.7
- Nevada: 19.9
- Mississippi: 19.2
- Wyoming: 18.7
- Alabama: 18.0
(Estimates from ACS with margins of error reported by NCFMR.)
Lowest refined divorce rates (2024)
- Maine: 10.0
- Wisconsin: 10.8
- New Jersey: 11.0
- Idaho: 11.2
- Montana: 11.7 (tied with South Carolina at 11.7)
What state clusters tend to have in common
These state clusters often reflect deeper demographic patterns. States with higher refined divorce rates often have younger marriage ages, higher remarriage turnover, or more mobile populations. States with lower refined divorce rates tend to have older ages at first marriage, different economic profiles, or cultural norms that emphasize later or more selective partnering.
While no single factor determines a state’s position, these broader patterns help explain why neighboring states sometimes look similar and why regional distinctions persist year after year.
Balance of unions and dissolutions (2024)
- Highest marriage-to-divorce ratio: New Jersey: 3.04 (more marriages per divorce)
- Lowest marriage-to-divorce ratio: Mississippi: 1.82 (fewer marriages per divorce)
A quick orientation: CDC’s crude rates are records-based and excellent for trendlines, but five states don’t report divorce counts to the national system (California, Hawaii, Indiana, Minnesota, New Mexico). ACS-based indicators (refined rate; ratio) cover all states and are better for same-year comparisons. Using both prevents false rankings.
What actually drives the numbers you see
Several structural forces shape the annual totals:
- Eligibility (who is “at risk”). When fewer people are married, fewer people can divorce. That’s why the refined divorce rate (per 1,000 married women) is so useful for comparing states and years. In 2024, it edged down again to 14.2.
- The balance of events. The marriage-to-divorce ratio climbed to 2.42 nationwide in 2024, roughly 2.4 marriages for every divorce, which aligns with the longer-term easing in divorce.
- Timing rules. Even when interest spikes, final decrees arrive later because states impose waiting periods (for example, California’s six-month minimum from service or response; Texas’s 60-day minimum from filing, with narrow exceptions).
- Coverage and method. CDC’s national divorce count and rate reflect 45 reporting states + D.C. because five states do not submit divorce data; ACS estimates include all states but come with margins of error.
Another piece of the shift is that fewer Americans marry in the first place. As marriage has become more selective and delayed, a smaller share of adults enters the pool of people who could legally divorce in any given year. Cohabitation, long-term partnerships, and delayed marriage all reduce the number of marriages at risk of formal dissolution. This helps clarify why crude divorce rates can fall even when relationship breakups still occur outside the legal system.
The long arc that explains today’s picture
Two slow-moving shifts sit behind the headline rates:
- Later marriage. The median age at first marriage now hovers around 30 for men and 28–29 for women, part of a climb that the Census MS-2 series traces back to 1890. Later marriage changes exposure to early divorce and helps explain why divorce fell among younger adults even as later-life divorce stabilized at higher levels.
- Life-stage divergence. NCFMR’s age profiles show that 1990 → 2021 brought a drop for ages 15–44 and a rise for ages 45+, with the steepest increase among 65+. In the closely related gray divorce story, the rate among adults 50+ rose from 3.9 (1990) to 11.0 (2008) and has leveled off, measuring 10.3 in 2023.
Taken together with the 2023 crude divorce rate (2.4 per 1,000 across 45 states + D.C.) and the 2024 refined rate (14.2), the direction is consistent: fewer divorces relative to the married population, more marriages than divorces overall, and a pattern that varies by age and state.
How to read our charts and tables (and not get tripped up)
- Use crude rates for trendlines. When you want to see the shape of the last two decades, lean on CDC/NCHS crude rates and counts. They’re records-based and comparable year over year (with the five-state caveat).
- Use refined rates and ratios for comparisons. When comparing states in 2024, use the refined divorce rate and the marriage-to-divorce ratio. They adjust for marriage prevalence and include margins of error.
- Don’t mix denominators. Avoid ranking a refined-rate list together with crude-rate values; each answers a different question. Our tables keep them separate by design.
Methods and limitations
- CDC/NVSS (records-based): National counts and crude rates for marriages and divorces. Divorce coverage is 45 states + D.C.; the national 2000–2023 table is provisional for 2023.
- NCFMR/ACS (survey-based): Annual indicators built from the ACS: refined divorce rate and marriage-to-divorce ratio (with state estimates and margins of error). Latest profiles are for 2024.
- Census MS-2 (historical timing): Median age at first marriage back to 1890, published as a data table and figure.
- Age & gray-divorce context: NCFMR’s age variation profile (1990 & 2021) and Pew’s 2025 synthesis (1990–2023).
- Seasonality warning: Federal tables are annual; monthly filing behavior is filtered through waiting periods and court calendars (e.g., CA six months, TX 60 days).
Conclusion
Divorce in the United States is steadily becoming less common overall, even though the patterns beneath the surface remain complex. The crude divorce rate: 2.4 divorces per 1,000 people in 2023, continues its long decline, and ACS-based indicators reinforce the trend: the refined divorce rate dipped to 14.2, and the marriage-to-divorce ratio rose to 2.42, meaning more marriages than divorces nationwide.
But the story isn’t uniform. Divorce has fallen sharply among younger adults, stabilized at higher levels among older adults, and varies widely by state, from Oklahoma’s 20.7 to Maine’s 10.0 divorces per 1,000 married women. Meanwhile, Americans are marrying later: around 30 for men and 28–29 for women, reshaping when and how often divorce occurs.
And while public attention often focuses on January, annual federal data smooth out seasonal filing behavior due to built-in delays, such as California’s six-month and Texas’s 60-day waiting periods.
Taken together, the 2026 landscape shows a gradually declining national divorce trend, tempered by age, timing, and state differences. Modern divorce is less about sudden spikes and more about long-term demographic shifts that continue to reshape marriage and separation across the country.
References
- CDC/NCHS. “FastStats: Marriage and Divorce.” https://www.cdc.gov/nchs/fastats/marriage-divorce.htm
- CDC/NCHS. “NVSS – Marriages and Divorces (methods & data access).” https://www.cdc.gov/nchs/nvss/marriage-divorce.htm
- CDC/NCHS. “Stats of the States – Divorce (state crude rates & non-reporting note).” https://www.cdc.gov/nchs/state-stats/more-maps/divorce.html
- CDC/NCHS. Provisional number and rates of marriages and divorces, 2000–2023 (PDF). https://www.cdc.gov/nchs/data/dvs/marriage-divorce/national-marriage-divorce-rates-00-23.pdf
- NCFMR (BGSU). Refined Divorce Rate in the U.S.: Geographic Variation, 2024 (FP-25-31). https://www.bgsu.edu/ncfmr/resources/data/family-profiles/fp-25-31.html
- NCFMR (BGSU). Marriage–Divorce Ratio in the U.S.: Geographic Variation, 2024 (FP-25-32). https://www.bgsu.edu/ncfmr/resources/data/family-profiles/fp-25-32.html
- U.S. Census Bureau. “Historical Marital Status Tables (MS-2).” https://www.census.gov/data/tables/time-series/demo/families/marital.html
- U.S. Census Bureau. Figure MS-2: Median Age at First Marriage, 1890 to Present (PDF). https://www.census.gov/content/dam/Census/library/visualizations/time-series/demo/families-and-households/ms-2.pdf
- NCFMR (BGSU). Age Variation in the Divorce Rate, 1990 & 2021 (FP-23-16). https://scholarworks.bgsu.edu/ncfmr\family\profiles/317/
- Pew Research Center. “8 facts about divorce in the United States.” (Oct. 16, 2025). https://www.pewresearch.org/short-reads/2025/10/16/8-facts-about-divorce-in-the-united-states/
- California Courts (Self-Help). “Divorce in California” (six-month minimum). https://selfhelp.courts.ca.gov/divorce-california
- Texas Statutes. Family Code § 6.702 (Waiting Period). https://statutes.capitol.texas.gov/GetStatute.aspx?Code=FA\&Value=6.702
Information only; not legal advice. Divorce is governed by state law, and timelines depend on case facts and local court procedures.
Share with
Author Bio
The Marble Team
Your family & immigration law firm
We are Marble - a nationwide law firm focusing on family & immigration law
See my bio page
Quality legal help for life’s ups and downs
Get started right away

Family Law
Immigration Law


Disclaimer
Attorney Advertising. Prior results do not guarantee a similar outcome. The individuals represented in photographs on this website may not be attorneys or clients, and could be fictional portrayals by actors or models. This website and its content (“Site”) are intended for general informational purposes only. It does not constitute legal advice and is no substitute for consulting a licensed attorney. Only an attorney can provide you with legal advice, only after considering your specific facts and circumstances. You should not act on any information on the Site without first seeking the advice of an attorney. Submitting information via any of the forms on the Site does not create an attorney-client relationship and no such communication will be treated as confidential. Marble accepts clients for its practice areas within the states in which it operates and does not seek to represent clients in jurisdictions where doing so would be unauthorized.
Quality legal care for life’s ups and downs
Get started
Our services
Client support


Disclaimer

Legal information